Plot cluster (or feature) selection proportions from cluster stability selection
plot.cssr.RdProduce a base-graphics bar plot of the selection proportions of a fitted
cssr object: one bar per cluster (the default) or per feature, sorted in
decreasing order of selection proportion. When cutoff > 0 a dashed
reference line is drawn at the cutoff (for type = "clusters"), and the bars
whose cluster (or feature) is selected – at the given cutoff and
cluster-count constraints – are highlighted in sel_col, the rest in
unsel_col.
Arguments
- x
An object of class "cssr" (the output of the function
css()).- cutoff
Numeric; the selection-proportion threshold used both to draw the dashed reference line (when greater than 0) and to determine which bars are highlighted as selected. The dashed reference line is drawn only for
type = "clusters"; fortype = "features"no line is drawn, because the bars show feature proportions while highlighting follows the cluster-level selection. Must be between 0 and 1. Default is 0 (in which case no reference line is drawn and, unlessmax_num_clustsrestricts it, every cluster is treated as selected).- min_num_clusts
Integer or numeric; the minimum number of clusters to treat as selected regardless of cutoff. (If the chosen cutoff would select fewer than min_num_clusts clusters, the cutoff is effectively lowered until at least min_num_clusts clusters are selected.) Default is 1. May be set to 0 to allow a pure cutoff-based highlight that can be empty (no bar highlighted) when no cluster's selection proportion meets the cutoff.
- max_num_clusts
Integer or numeric; the maximum number of clusters to treat as selected regardless of cutoff. (If the chosen cutoff would select more than max_num_clusts clusters, the cutoff is effectively raised until at most max_num_clusts clusters are selected.) Default is NA (in which case max_num_clusts is ignored). Because clusters can have tied selection proportions, ties at the threshold can cause more than max_num_clusts bars (or fewer than min_num_clusts) to be highlighted; when the two constraints conflict, max_num_clusts takes precedence.
- type
Character; either "clusters" (the default) to plot one bar per cluster, or "features" to plot one bar per feature. May be abbreviated.
- weighting
Character; passed to
getCssSelections()to determine which individual features are selected (and therefore highlighted) whentype = "features". It has no effect on the cluster bars or on which clusters are highlighted. Must be one of "sparse", "weighted_avg", or "simple_avg". Default is "sparse" (matchinggetCssSelections()andselected()).- ylim
Numeric vector of length 2; the y-axis limits for the bar plot. Default is
c(0, 1), the natural range of a selection proportion.- sel_col
The color used to fill the bars of selected clusters (or features). Default is "steelblue".
- unsel_col
The color used to fill the bars of unselected clusters (or features). Default is "grey70".
- ...
Additional graphical parameters passed on to
graphics::barplot()(for examplemainorcex.names). The bar heights, fill colors, andylimare controlled by this method; supplyingcolhere, or theylimargument, overrides the highlight colors or the default y-axis limits.
Value
Invisibly, the numeric vector of selection proportions that were
plotted: the colMeans() of the cluster (or feature) selection matrix,
sorted in decreasing order, named by cluster (always) or by feature (when the
features of X were named; unnamed otherwise). Called primarily for its side
effect: drawing the bar plot.
Details
The selection that determines the highlight is obtained from
getCssSelections() with the same cutoff, min_num_clusts,
max_num_clusts, and weighting. Which clusters are selected does not
depend on weighting; which features are selected does (the weighting
determines which members of the selected clusters have nonzero weight and are
therefore highlighted when type = "features").
Note that, to match the positional argument order of print.cssr(), the
second positional argument is cutoff; type, weighting, and the
graphical parameters must be supplied by name (for example
plot(x, type = "features")).
See also
print.cssr() and summary.cssr() for printed / tabular overviews
of the same selection proportions; selected() to extract the selected
clusters or features; getCssSelections() for the underlying selection used
to highlight the bars.
Examples
set.seed(1)
data <- genClusteredData(n = 50, p = 11, k_unclustered = 2,
cluster_size = 4, n_clusters = 1, snr = 3)
# Name the features so the feature plot shows labeled, highlighted bars
# (genClusteredData returns X with no column names).
X <- data$X
colnames(X) <- paste0("V", seq_len(ncol(X)))
clusters <- list(cluster1 = 1:4)
res <- css(X = X, y = data$y, lambda = 0.01, clusters = clusters, B = 10)
# Cluster selection proportions (the default):
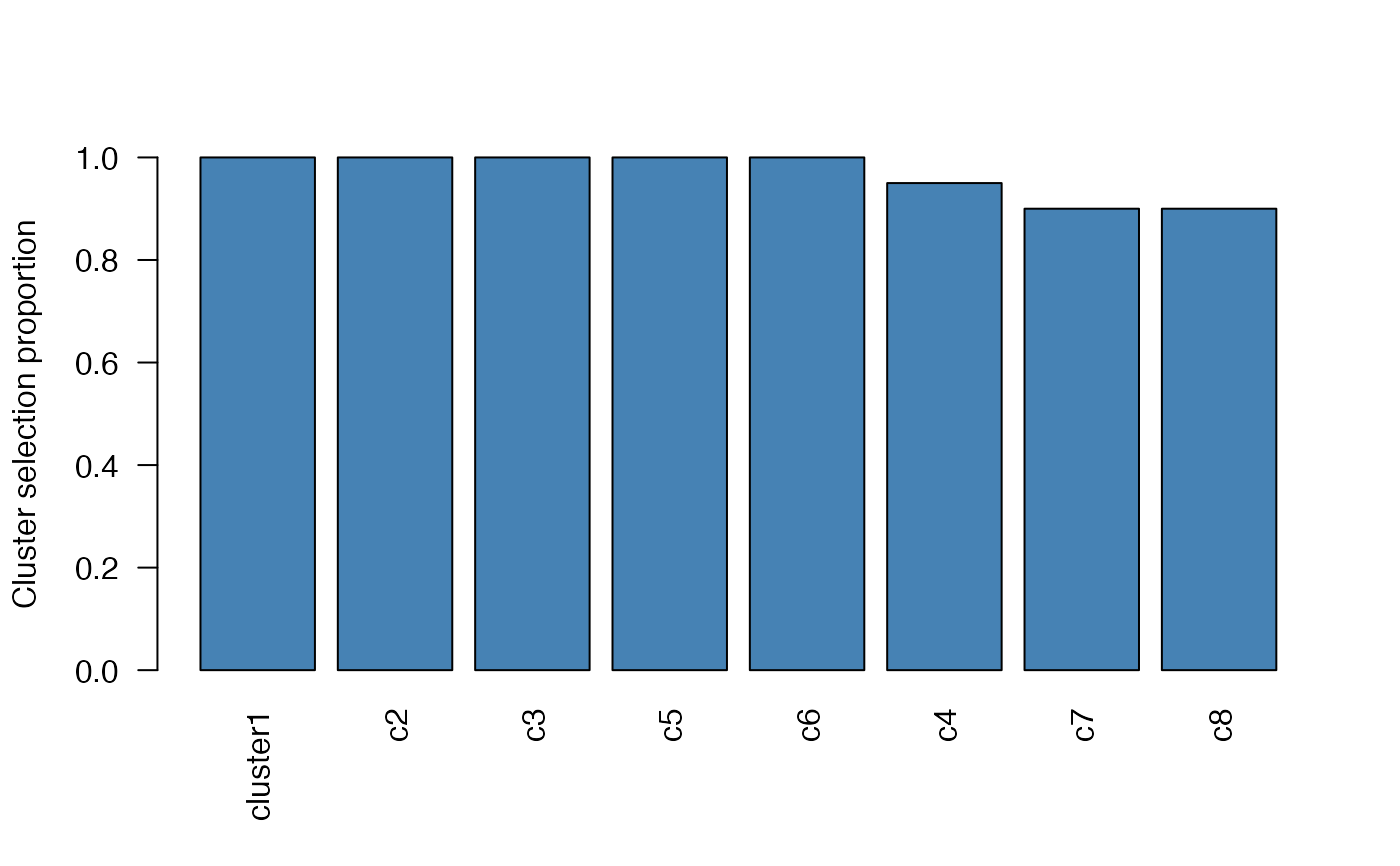
plot(res)
 # Feature selection proportions, highlighting the selected features:
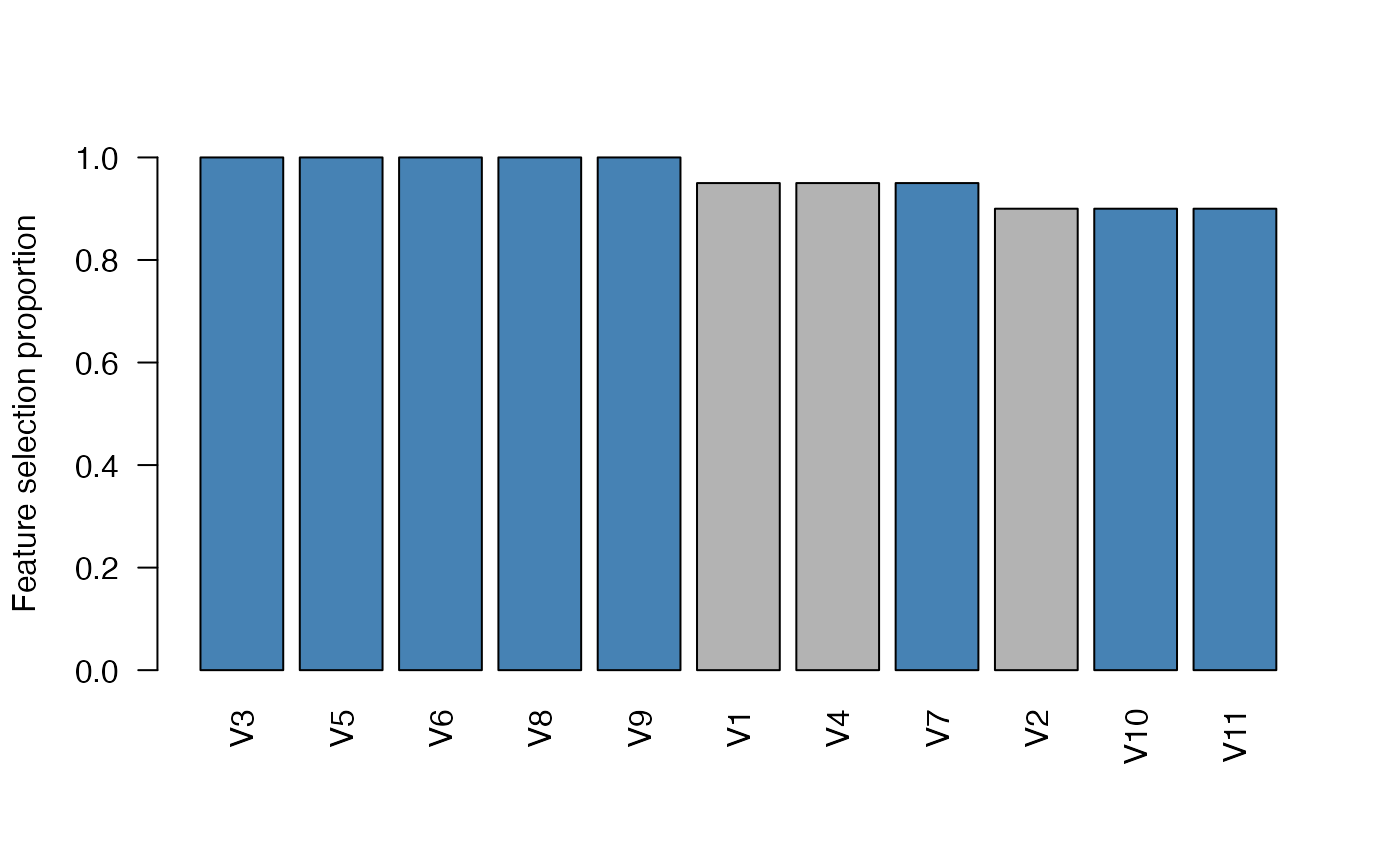
plot(res, type = "features")
# Feature selection proportions, highlighting the selected features:
plot(res, type = "features")